2026 Financial Architecture
Objective: Outperform the S&P 500 baseline through a concentrated, first-principles approach to asset allocation.
Strategy: Active Satellite (Highly concentrated, high-conviction individual equity positions).
Update Cadence (SOP): Monthly.
1. Macro Market Thesis (Live Dashboard)
Last Updated: 07.17.2026
Core Economic Indicators (Live Tracker)
A high-signal dashboard of the leading indicators dictating current capital flow.
| Metric | Prior Read | Current Read | Delta | Status | Implication |
|---|---|---|---|---|---|
| ✍️ ISM Manufacturing PMI | 53.3 | 55.6 | +2.3 pts | Expansion (Bullish) | Accelerating Momentum |
| ✍️ ISM New Orders | 56.0 | 56.7 | +0.7 pts | Leading Expansion | Telegraphs Forward Growth 3-6M |
| ✍️ ISM Prices Paid | 73.0 | 71.1 | -1.9 pts | Currency Debasement | Capital Rotates to Dollar Hedges |
| ⚡ Fed Funds Target Rate | 3.63% | 3.63% | +0.00% | Falling/Stable | Stable Baseline |
| ⚡ CPI (Inflation) | 4.17% | 3.46% | -0.71% | Falling/Stable | Monitoring Shift |
| ⚡ Total Nonfarm Payrolls | 129.00k | 57.00k | -72.00k | Falling/Stable | Monitoring Shift |
| ⚡ PPI: Corrugated Boxes | 366.92 | 375.49 | +2.34% | Rising | Monitoring Shift |
Current Insight: The macro environment is currently defined by dual disruptors: the proliferation of AI and geopolitical instability in the Middle East. The core question is consumer resilience—will sustained premiums in energy and gas prices erode discretionary spending?
To answer this, we look past the news cycle and rely on hard data. CPI and labor force metrics are essential, but the true north is the grandfather of them all: the ISM Manufacturing PMI. The ISM acts as a leading indicator for Total Nonfarm Payrolls (NFP). Since nonfarm workers make up 80% of the U.S. workforce, predicting the NFP effectively predicts the pulse of the economy. More jobs equal more household income, leading to economic expansion, fluctuating bond yields, and shifts in the dollar’s strength. The ISM reveals the employment reality before the actual data drops.
Understanding the ISM is an exercise in reading momentum. Expressed as a percentage, an ISM reading above 50 signals economic expansion—more money flowing through the system. Below 50 indicates contraction and tightened wallets. It acts like a Russian doll: anything below 42.3 is an extreme contraction, but hovering just above that means the economy is expanding, albeit at a slower, riskier pace. Nested within this is the “ISM New Orders” index. When New Orders cross above 50, manufacturing is telegraphing an expansion in the next 3 to 6 months. Optimally, a fully bullish economy fires on both cylinders. As of this writing, both are above 50, indicating a rise in the next 3-to-9 month period.
When assessing a strong PMI, we must isolate “Prices Paid.” If prices paid are rising, it signals currency debasement. Capital naturally flows into dollar hedges like gold and silver, driving positive price action. Conversely, a strong ISM paired with contracting prices paid is broadly bearish for precious metals. This macro flow extends directly into cryptocurrencies. Historically, Bitcoin has never boomed without the PMI in an expansionary phase. Regardless of what the technical charts say, Bitcoin’s limited history shows a strong reliance on a healthy PMI.
Back in the equity markets, the ISM boasts a ~78% correlation with future Earnings Per Share (EPS). While Gross Domestic Product (GDP) tells you the history of the last quarter, the ISM tells you the future of the next three to four months. This brings me to the ISM’s cousin: the Producer Price Index (PPI). Because producers pass costs down to consumers, the PPI offers raw insight into business velocity. My favorite underlying metric here is the corrugated shipping container index. Physical goods ship in boxes. If box demand is up, the economy is booming; if it slows down, contraction is imminent. Politicians or news anchors may spin a different narrative, but if you want the truth in data, follow the boxes.
Furthermore, 2026 is a midterm election year. A century of historical data suggests that post-October, the market generates strong upward momentum. Despite the cliché “this time is different” unknowns, historical probabilities favor a Q4 rally.
Finally, we are witnessing a Holyfield vs. Tyson heavyweight fight between traditional SaaS and generative AI. As end-users leverage AI to build custom solutions, untested software names will face extinction, while entrenched incumbents (like Microsoft) will solidify their moats. This paradigm shift dictates my current capital allocation.
2. System Metrics & Sector Exposure
Tracking precise capital distribution, concentration risk, and structural sector exposure.
Capital Allocation & Risk
- Cash Position: 12.98% *
YTD Performance
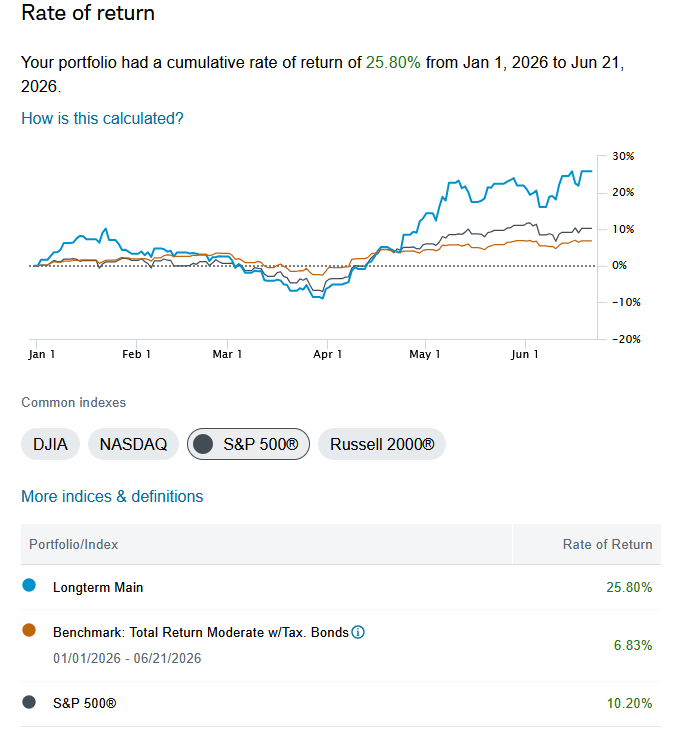 *(Note: Cumulative rate of return from Jan 1 to current update. Image scales dynamically for mobile viewing.)*
3. 2026 Deployments (Recent Capital Flow)
Where new cash is actively being deployed this year and the immediate logic behind it.
| Ticker | Asset Class | Execution | Thesis / Catalyst |
|---|---|---|---|
| ORCL | Technology (Cloud) | Buy (07/28/2026) 10 sh @ $116.11 avg | Same as below |
| SWVXX | Cash Equivalent | Sell (07/27/2026) 1,400 sh @ $1.00 | Needed liquidity |
| ORCL | Technology (Cloud) | Buy (07/24/2026) 10 sh @ $120.16 | Its everywhere. It’ll be here in 10 years. Its cheap. |
| CRSR | Technology (Hardware) | Buy (07/24/2026) 100 sh @ $10.14 | Potential next rotation, cheap |
| SWVXX | Cash Equivalent | Buy (07/10/2026) 18,346 sh @ $1.00 | Money should always be working |
| MSFT | Technology (Software) | Buy (06/25/2026) 4 sh @ $352.40 avg | Cheap relative to its assets |
| INTC | Technology (Semiconductors) | Sold 3x Dec 2028 $200 Calls (06/22/2026) | Collected $17,382.64 in premium on long-dated calls while staying long semiconductor recovery. |
| MSFT | Technology (Software) | Buy (06/17/2026) @ $378.10 | Dominant cloud and AI infrastructure leader with durable pricing power and enterprise stickiness. |
| INTU | Technology (Software) | Buy (06/17/2026) @ $269.59 | High-quality small business software compounder with strong recurring revenue and AI tailwinds. |
| INTU | Technology (Software) | Buy (06/10/2026) @ $285.89 | Adding to fintech software leader at reasonable valuation. |
| KMB | Consumer Staples | Buy (06/04/2026) @ $95.67 | Defensive staple with pricing power and resilient cash flow in uncertain macro environment. |
| MSFT | Technology (Software) | Buy (04/10/2026) @ $371.41 | Core long-term holding in cloud + AI infrastructure with unmatched enterprise distribution. |
| FISV | Financials (Fintech) | Add (03/16/2026) @ $57.03 | Undervalued legacy fintech with sticky enterprise contracts and improving execution. |
| ORCL | Technology (Cloud) | Buy (03/05/2026) @$153.5 | Benefiting from aggressive shift toward database and cloud infrastructure modernization. |
4. Execution & Systems Reflection (Historical Log)
Q2 Review (June 2026 Update):
On June 22nd I sold 3 contracts of the INTC Dec 2028 $200 calls and collected $17,382.64 in premium. This was a deliberate move to harvest income on a name I still view as a primary long-term anchor. Took risk completely off the table and it gives me options to roll over in the future. Intel remains one of my highest-conviction holdings after the government support and foundry momentum started to show up in the price action. I’m comfortable staying long the stock while using the call sale to reduce cost basis(now negative) and generate cash.
In mid-June I added to MSFT and INTU. Both were opportunistic adds into software names that had pulled back. Microsoft continues to serve as the core cloud and AI infrastructure holding with unmatched distribution, while Intuit offers a high-quality, sticky small-business compounder with recurring revenue and AI tailwinds. These were smaller, measured deployments rather than aggressive sizing.
Earlier in the year I added McDonald’s (MCD) as a defensive, high-quality balance against higher-beta names like Sweetgreen (SG). MCD provides gravitational stability in the consumer space, especially with leading indicators still showing resilience despite short-term pressure on discretionary spending. I also maintain positions in Oracle and the earlier FISV add, both of which were executed when the software and fintech sectors were under pressure. I still see structural value in these incumbents long-term.
I’m currently monitoring KMB and TAP as potential defensive additions, but I’m being patient. Parts of the market feel stretched while other areas remain in lukewarm territory. My priority remains preserving dry powder for asymmetric, high-margin-of-safety opportunities. With midterms historically providing a tailwind into year-end, I’m comfortable sitting on cash until clearer setups present themselves rather than forcing deployments.
Q3 Review (July 2026 Update):
July leaned on the macro backdrop more than any quarter so far. ISM and New Orders are both still holding above 50, which by my own framework means the economy is firing on both cylinders and the next 3-to-9 months should keep trending expansionary — that’s the backdrop that gave me the confidence to keep deploying rather than sit in cash. Prices Paid staying elevated at 82.1 is still the currency-debasement signal I flagged in the dashboard, and the corrugated box index ticking up 2.34% is the same “follow the boxes” confirmation — real goods are moving, this isn’t a paper expansion.
On the cash side, I moved $18,346 into SWVXX on the 10th to keep dry powder productive, then pulled $1,400 back out on the 27th to fund the next leg of buys. Same discipline as Q2 — preserve optionality, deploy when the setup is there.
The bulk of that redeployment went into Oracle — 10 shares at $120.16 on the 24th, another 10 at $116.11 average on the 28th — buying the pullback on the same cloud/database modernization thesis I’ve been running all year. The SaaS-vs-AI paradigm shift keeps favoring the entrenched incumbents with the infrastructure moat, and Oracle’s still squarely in that lane. Added to MSFT too on the 25th (4 shares, $352.40 average), staying consistent with the core cloud and AI infrastructure position.
CRSR is the high-risk, high-reward add — 100 shares at $10.14. I’m reading this through sector rotation: cyber ran, chips ran, software’s had its leg up too, and memory’s been moving. Gaming hardware/peripherals feels like it could be next in that rotation, and CRSR was cheap enough that the asymmetry made sense to me — small size, but real upside if the rotation reaches it.
Zooming out, the macro still supports the aggressive posture. With the ISM’s ~78% correlation to forward EPS still intact and Q4 historically strong in a midterm year, I’m comfortable staying deployed into names with real conviction (ORCL, MSFT) while keeping a small speculative sleeve (CRSR) for asymmetric upside if the rotation plays out the way sector price action is suggesting.